Know that your exhibition spend
produces
qualified pipeline
Stop justifying exhibition budgets with anecdotes. Show your management exactly what each event produced: qualified opportunities, decision-makers met, pipeline generated – not just foot traffic.
No credit card required.
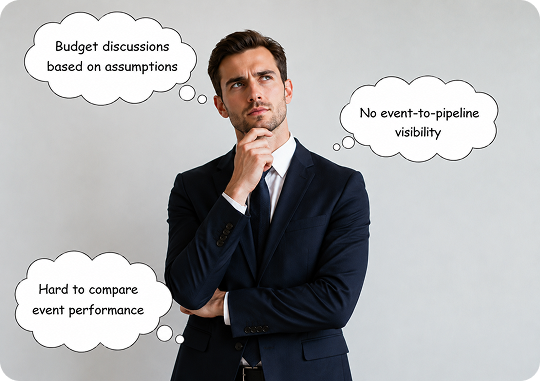
The budget question
You’re allocating a finite marketing budget across channels: digital advertising, content marketing, direct sales, and exhibitions.
Exhibitions are expensive – booth costs, travel, accommodation, your team’s time away from other opportunities. A single 3-day event can cost $6,000-12,000 (₹5-10 lakhs) or more.
Your management expects evidence, not anecdotes.
They want to know:
Did this exhibition generate qualified pipeline? How does event ROI compare to other channels? Should we increase, maintain, or cut exhibition spend?
Right now, you don’t have good answers.
From anecdotes to accountability

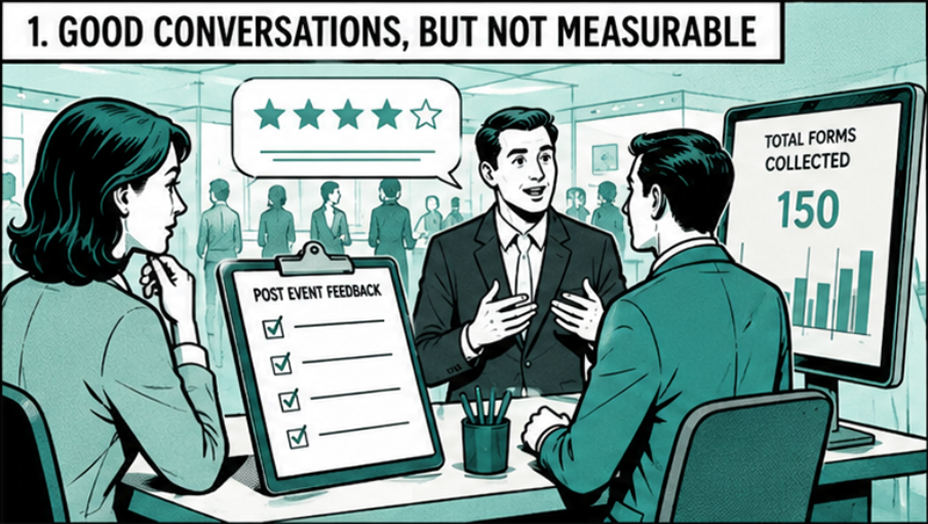
We had good conversations' doesn't cut it
After every exhibition, your team reports back: 'We had great conversations. Lots of interest in the new product line. We collected 150 forms.' But what does that actually mean? How many were decision-makers? How many turned into proposals? How many closed?
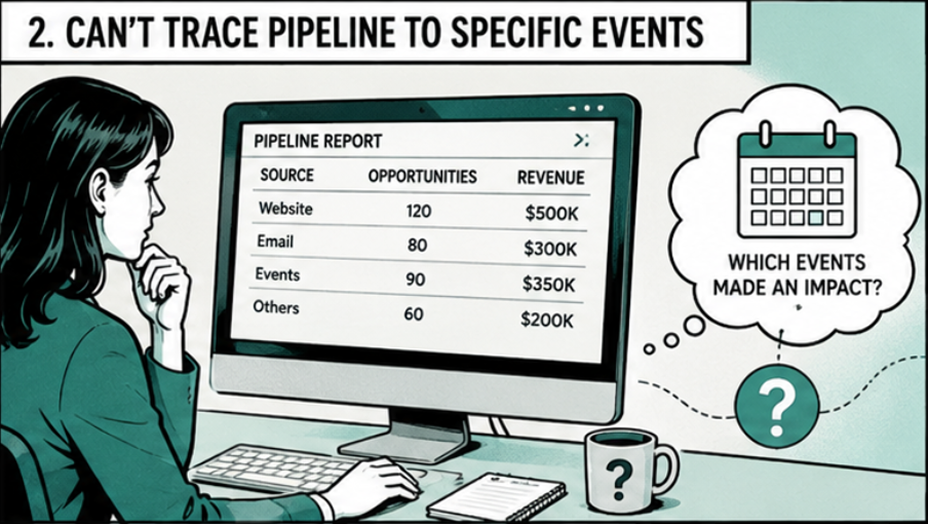
You can't trace pipeline back to specific events.
You can't trace pipeline back to specific events. You can't compare this exhibition to the last three. You can't tell which events are worth attending again.
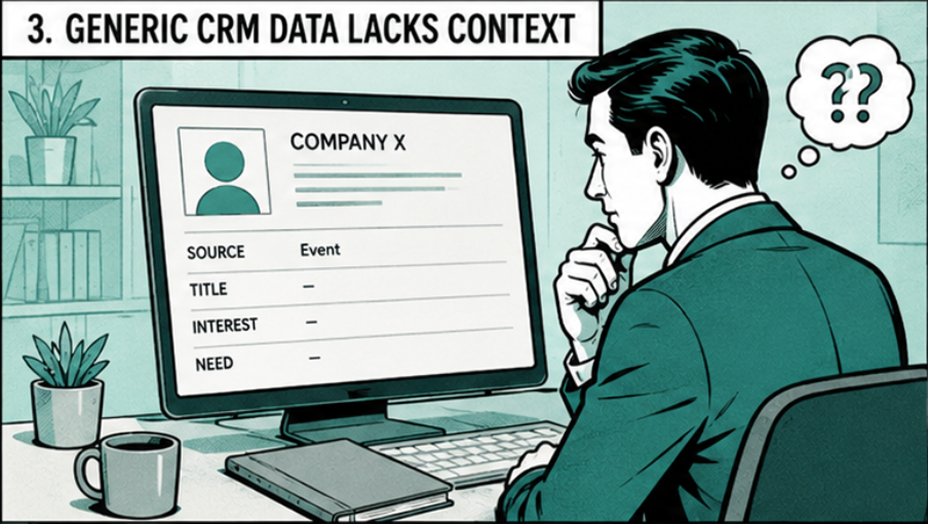
Generic CRM data doesn't tell the event story
Even when leads eventually get entered into your CRM, the event context is lost. You know a prospect from Company X is in your pipeline, but you don't know: which event they came from, what they asked about, how urgent their need was, or whether your team flagged them as hot.
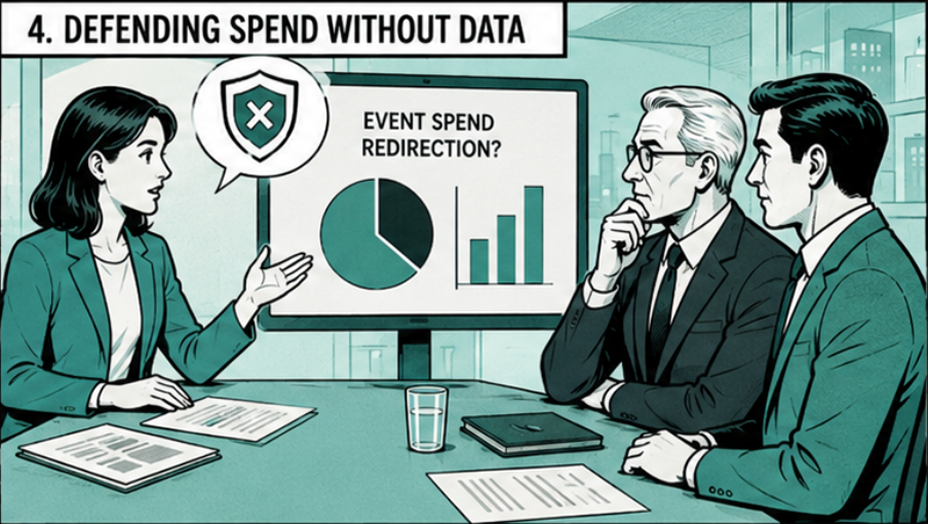
You're defending exhibition spend on faith, not facts
When someone at the management table suggests redirecting exhibition budget to digital marketing, you don't have data to defend your position. You're relying on gut feel and tradition.
What you'll actually see
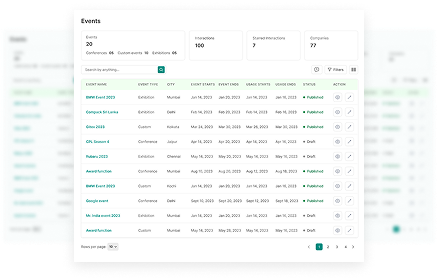
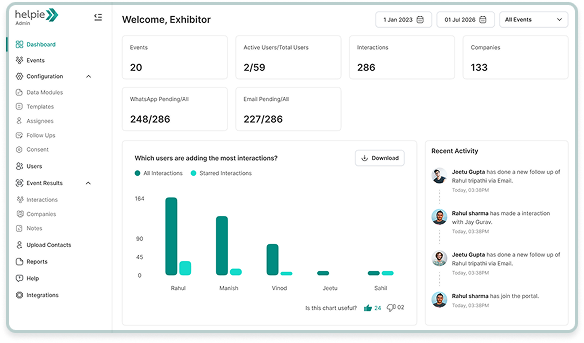
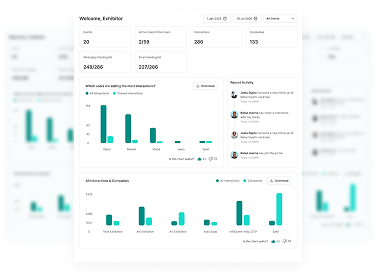
Dashboard shows real outcomes, not just activity
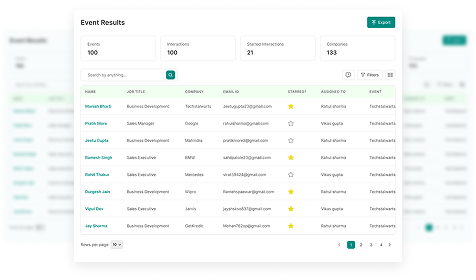
Instead of telling your management ‘we collected 150 forms,’ you show them: 150 interactions captured, 47 were decision-makers, 23 were hot leads assigned to senior reps, 12 are already in proposal stage, estimated pipeline value $300,000 (₹2.5 crore).
Compare events against each other
See which exhibitions generated the most qualified leads. Compare visitor quality across events. Track which products drew the most interest at each show. Make data-driven decisions about which events to attend next year.
Trace pipeline back to specific events
When a deal closes six months later, you know exactly which exhibition generated that lead, what was discussed at the booth, and who on your team met them. You can calculate actual event ROI, not guessed ROI.
Justify your exhibition budget with evidence
Present to your management: $10,000 (₹8 lakhs) invested in Event X generated 47 qualified opportunities worth $380,000 (₹3.2 crore) in potential pipeline. Event ROI: 4x. Compare that to your digital ad spend or content marketing ROI.
Is my data safe?
What happens to our confidential customer data?
Your data is encrypted in transit and at rest. We follow enterprise-grade security practices. Your interaction data is isolated to your account – we never share it with event organizers or third parties.
Who can see our exhibition data?
Only users you explicitly add to your Helpie Event account can see your data. You control access completely.
Sales & business leaders who measure what matters